| Title |
UCUI_1974_AnnualReport |
| Creator |
San Francisco: Utah International |
| Description |
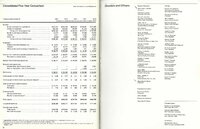
The report includes information about the company for the fiscal year ending October 31, 1974. This consists of a management comment to the shareholders, an abstract of operations, properties and interests, and financial statements including the auditors' report. |
| Subject |
Auditors’ reports; Financial executives; Corporation reports; Financial statements; Financial statements notes; Stockholders |
| Digital Publisher |
Stewart Library, Weber State University, Ogden, Utah, USA |
| Date Original |
1974 |
| Date |
1974 |
| Date Digital |
2006 |
| Temporal Coverage |
1947; 1948; 1949; 1950; 1951; 1952; 1953; 1954; 1955; 1956; 1957; 1958; 1959; 1960; 1961; 1962; 1963; 1964; 1965; 1966; 1967; 1968; 1969; 1970; 1971; 1972; 1973; 1974; 1975; 1976 |
| Item Size |
8.5 inch x 11 inch |
| Medium |
books |
| Item Description |
37 page paper report bound in landscape format |
| Type |
Text; Image/StillImage |
| Conversion Specifications |
Archived TIFF images were scanned with an Epson Expression 10000XL scanner. JPG and PDF files were then created for general use. Transcripts generated by OCR (optical character recognition). |
| Language |
eng |
| Relation |
https://archivesspace.weber.edu/repositories/3/resources/212 |
| Rights |
Materials may be used for non-profit and educational purposes; please credit Special Collections Department, Stewart Library, Weber State University. |
| Source |
UCC/UIC 1900-1984 MS 100 Box 6, Special Collections, Stewart Library, Weber State University |
| Format |
application/pdf |
| ARK |
ark:/87278/s6dktx09 |
| Setname |
wsu_ucui_ar |
| ID |
97948 |
| Reference URL |
https://digital.weber.edu/ark:/87278/s6dktx09 |
| Title |
UCUI_1974_AnnualReport - 1974_019_page36&37 |
| Description |
The report includes information about the company for the fiscal year ending October 31, 1974. This consists of a management comment to the shareholders, an abstract of operations, properties and interests, and financial statements including the auditors' report. |
| Subject |
Auditors' Report;Directors and Officers;Financial Highlights;Financial Statements;Management Comment;Operations;Properties and Interests;Shareholders |
| Digital Publisher |
Stewart Library, Weber State University, Ogden, Utah, USA |
| Date Original |
1974 |
| Date |
1974 |
| Temporal Coverage |
1947-1976 |
| Item Size |
8.5 inch x 11 inch |
| Medium |
books |
| Type |
Text; Image/StillImage |
| Conversion Specifications |
Archived TIFF images were scanned with an Epson Expression 10000XL scanner. JPG and PDF files were then created for general use. Transcripts generated by OCR (optical character recognition). |
| Relation |
https://archivesspace.weber.edu/repositories/3/resources/212 |
| Rights |
Materials may be used for non-profit and educational purposes; please credit Special Collections Department, Stewart Library, Weber State University. |
| Format |
application/pdf |
| Setname |
wsu_ucui_ar |
| ID |
98236 |
| Reference URL |
https://digital.weber.edu/ark:/87278/s6dktx09/98236 |


