| Title |
595_Mining Opportunities in Mexico |
| Creator |
Utah Construction Company |
| Description |
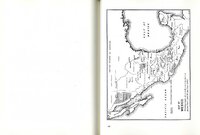
In 1928, Utah Construction Company completed its first project outside of the United States with the 110 mile railroad for Southern Pacific of Mexico. Over the next 30 years, UCC continued to work on projects in Mexico including dams, roads, mining, and canals. The collection contains several booklets and correspondence along with approximately 500 photographs. |
| Subject |
Ferrocarril Sud Pacífico de Mexico--History; Mexico; Dams--Design and construction; Asphalt pavers--Mexico; Canals--Mexico; Sonora (Mexico : State); Chihuahua (Mexico : State); Sinaloa (Mexico : State); La Quemada (Mexico); Tepic (Mexico : Territory); Railroads--Design and construction |
| Digital Publisher |
Stewart Library, Weber State University, Ogden, Utah, USA |
| Date Digital |
2010 |
| Temporal Coverage |
1923-1928; 1945-1958 |
| Item Size |
8.5 x 11 inch |
| Medium |
correspondence |
| Item Description |
60 page book |
| Spatial Coverage |
Mexico, http://sws.geonames.org/3996063, 23, -102 |
| Type |
Text |
| Conversion Specifications |
Archived TIFF images were scanned with an Epson Expression 10000XL scanner. |
| Language |
eng |
| Relation |
https://archivesspace.weber.edu/repositories/3/resources/212 |
| Rights |
Materials may be used for non-profit and educational purposes; please credit Special Collections Department, Stewart Library, Weber State University. |
| Source |
MS 100 Bx 93, 100, 101 Special Collections, Stewart Library, Weber State University |
| Format |
application/pdf |
| ARK |
ark:/87278/s6r0hskr |
| Setname |
wsu_ucc_mp |
| ID |
58354 |
| Reference URL |
https://digital.weber.edu/ark:/87278/s6r0hskr |
| Title |
016_page 9 |
| Creator |
Utah Construction Company |
| Contributors |
Utah Construction Company |
| Description |
In 1928, Utah Construction Company completed its first project outside of the United States with the 110 mile railroad for Southern Pacific of Mexico. Over the next 30 years, UCC continued to work on projects in Mexico including dams, roads, mining, and canals. The collection contains several booklets and correspondence along with approximately 500 photographs. |
| Subject |
Ferrocarril Sud Pacífico de Mexico--History; Mexico; Dams--Design and construction; Asphalt pavers—Mexico; Canals--Mexico; Sonora (Mexico : State); Chihuahua (Mexico : State); Sinaloa (Mexico : State); La Quemada (Mexico); Tepic (Mexico : Territory); Railroads--Design and construction |
| Digital Publisher |
Stewart Library, Weber State University, Ogden, Utah, USA |
| Date Digital |
2010 |
| Temporal Coverage |
1923-1928; 1945-1958 |
| Medium |
photographs |
| Item Description |
8.5 x 11 in. paper |
| Spatial Coverage |
Mexico, http://sws.geonames.org/3996063, 23, -102 |
| Type |
Image/StillImage |
| Conversion Specifications |
Archived TIFF images were scanned at 400 dpi with an Epson Expression 10000XL scanner. |
| Language |
eng |
| Relation |
https://archivesspace.weber.edu/repositories/3/resources/212 |
| Rights |
Materials may be used for non-profit and educational purposes; please credit Special Collections Department, Stewart Library, Weber State University. |
| Source |
MS 100 Bx 93, 100, 101 Special Collections, Stewart Library, Weber State University |
| Format |
application/pdf |
| Setname |
wsu_ucc_mp |
| ID |
58966 |
| Reference URL |
https://digital.weber.edu/ark:/87278/s6r0hskr/58966 |


